.png?width=200&height=58&name=RheoSense%20Logo%20(REGISTERED).png)

Characterization of non-Newtonian Fluids
Introduction
Flow behavior of complex fluids is traditionally characterized employing either sophisticated rheometers or conventional viscometers. The former require profound understanding of the equipment and careful examination of the measurements. Moreover, rheometers tend to be very expensive. On the other hand, conventional viscometers are less refined and often function as viscosity indexers without proper characterization of shear rate and viscosity. RheoSense’s m-VROC® technology offers a precise and cost effective alternative solution to characterize viscosity of both Newtonian and non-Newtonian fluids. m-VROC® precision rivals that of a rheometer and yet it presents straightforward operation and results analysis.
In this application note, we test our system against a certified non-Newtonian standard. Additionally, we present evidence of non-Newtonian behavior in water/cellulose solutions that are commonly used in biopharmaceutical applications. Finally, we review how our technology provides measurements of true viscosity.
Test Materials & Applications
Standard Reference Material (SRM) 2490 (NIST) is a solution of Polyisobutylene in 2,6,10,14-Tetramethylpentadecane which displays a well characterized and certified non-Newtonian shear thinning behavior (i.e. viscosity decreases as shear rate increases).
Methocel™ (Dow Chemical) are mixtures of water-soluble methylcellulose and hydroxypropyl methylcellulose polymers. They are derived from pine pulp and used as thickeners, binders, film formers and for water retention. They also function as suspension aids, protective colloids and emulsifiers.
Testing Protocol:
- Loading: Test sample is loaded into a syringe and mounted into the syringe pump.
- Measuring: Using m-VROC® software, viscosity is measured as a function of shear rate and/or temperature. For all tested materials displaying a shear-dependent viscosity, the Weissenberg-Rabinowitsch-Mooney (WRM) correction is applied to obtain “true shear rate” and “true viscosity”.
Cleaning: An appropriate cleaning solvent is run through the flow path between different samples and after testing.
Non-Newtonian Standard
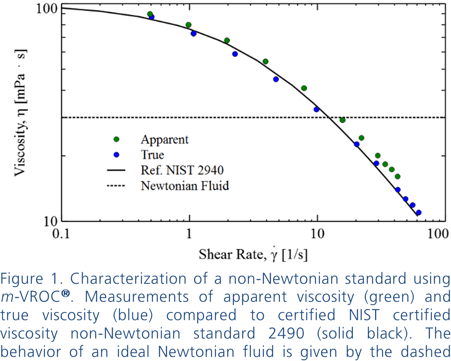
In Figure 1, we present viscosity as a function of shear rate for SRM 2490. A clear non-Newtonian shear thinning behavior is observed (i.e. viscosity strongly decreases with increasing shear rate).
For non-Newtonian fluids, the viscosity dependence on shear rate causes the velocity profile inside the VROC® channel to be non-parabolic. In that case, the true shear rate at the wall is necessary to obtain true viscosity as: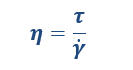
where τ is the shear stress at the wall, which is measured precisely by m-VROC®. Using the WRM correction the true shear rate at the wall is obtained as [1]:
 (2)
(2)
where apparent shear rate γapp is given by the flow rate and the microfluidic channel dimensions. More details on the WRM correction are given in the Appendix.
As anticipated, the correction improves the agreement with the reference viscosity profile (see Figure 1). The dashed line shows the typical behavior of a Newtonian fluid (i.e. Viscosity is independent of shear rate). These results confirm not only the high accuracy of VROC® technology but also its suitability for the characterization of the viscosity of both Newtonian and non-Newtonian fluids.
Cellulose Water solutions
As shown for SRM 2490, non-Newtonian fluids can present significant dependence of viscosity on shear rate. However, it is important to note that this dependence might not be observed at low or moderate shear rates. For some systems, non-Newtonian effects might only appear at high shear rates [2]. Therefore, testing the viscosity of these fluids at shear rates that are relevant for the specific application is essential for the proper characterization of viscosity that is needed for process modeling. Table 1 presents a collection of common applications and their associated shear rates.
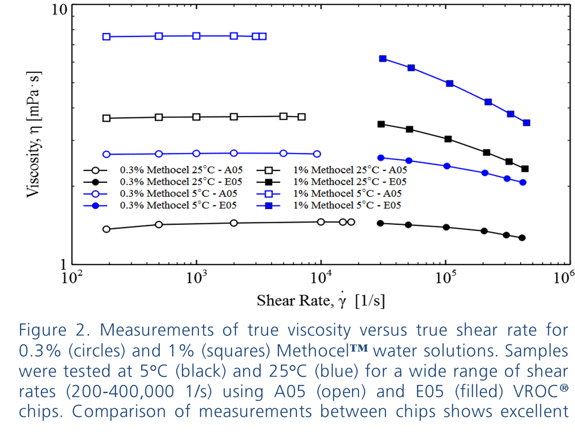
Table 1. Common applications and characteristic shear rates. m-VROC® can measure viscosity between and [1/s].
|
Application |
Shear rate [1/s] |
|
Sag and Leveling |
10-2-100 |
|
Flow coating, mixing |
100-102 |
|
Brushing, roll coating |
102-104 |
|
Injectability, Lubrication |
104-107 |
In Figure 2, we present results for two different concentrations of Methocel™ at two different temperatures. As expected, viscosity decreases with increasing temperature. We tested two different shear rate ranges and observed that at low shear rates Methocel™ solutions act as Newtonian fluids while at high shear rates they display non-Newtonian behavior.
As a result of the small scale of the flow channel, m-VROC® allows measurement of viscosity at much higher shear rates than what is achievable with conventional rheometers, for which shear rate is limited by the appearance of flow instabilities [1].
Summary
In this technical note, we demonstrate m-VROC® suitability for the characterization of complex fluids over a wide range of shear rates. Our technology is able to successfully reproduce the shear rate-dependent viscosity of a certified non-Newtonian standard. VROC® technology is a powerful tool in the rheological characterization of the behavior of fluids at high shear rates that are not accessible by convectional rheometers and viscometers. As an example of m-VROC® capabilities, we present results for two cellulose water solutions present in many applications.
Appendix: WRM Correction Protocol
m-VROC® software includes an optional feature to automatically apply WRM correction and obtain measurements of true viscosity. The only requirement is to perform measurements of viscosity at three or more shear rates. However, some applications might require comparison of viscosity at specific shear rates (i.e. compare different samples). In this appendix, we present the steps necessary to obtain true viscosity at specific/target shear rates from the shear stress and apparent shear rate measurements that result from a shear rate sweep.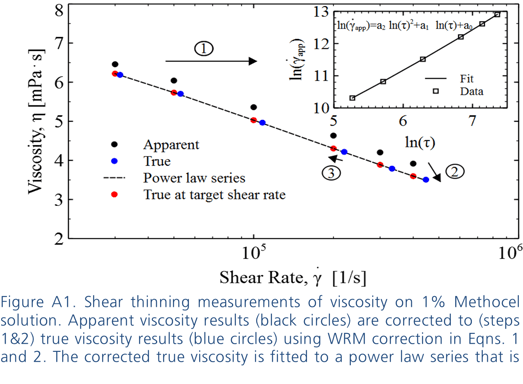
First we perform a rate sweep using m-VROC® software automatic function (See Figure A1). Ideally, we want to cover a slightly wider range of shear rates than the one covered by the target shear rates.
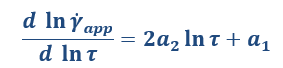
Then, we use shear stress and shear rate from the results report to create the inset in Figure A1 (step 1). We fit these results to a second order polynomial and obtain from it the first order derivative of the logarithm of the shear rate with respect to the logarithm of the shear stress:
To obtain true shear rate, we apply the WRM correction in Eq. (2). True viscosity is then calculated using Eq. (1). Note that the correction is done through the shear rate. As a result, the obtained true viscosity values (blue circles) are displaced to the right (step 2 in Figure A1).
Finally, we fit a power law (or power law series) to the true viscosity data and apply this law to calculate viscosity at the target shear rates (step 3 in Figure A1).
References
|
[1] |
C. Macosko, Rheology: Principles, Measurements and Applications, Wiley, 1994. |
|
[2] |
C. J. Pipe, T. S. Majmudar and G. H. McKinley, "High Shear Rate Viscometry," Rheol. Acta, 2008. |
Blood App Note
-1.png?width=540&height=540&name=Blood%20Viscosity%20m-VROC%20II%20App%20Note%20Tile%20(small)-1.png)
Download Brochure

LNP App Note
-1.png?width=540&height=540&name=LNP%20m-VROC%20II%20App%20Note%20Tile%20(small)-1.png)
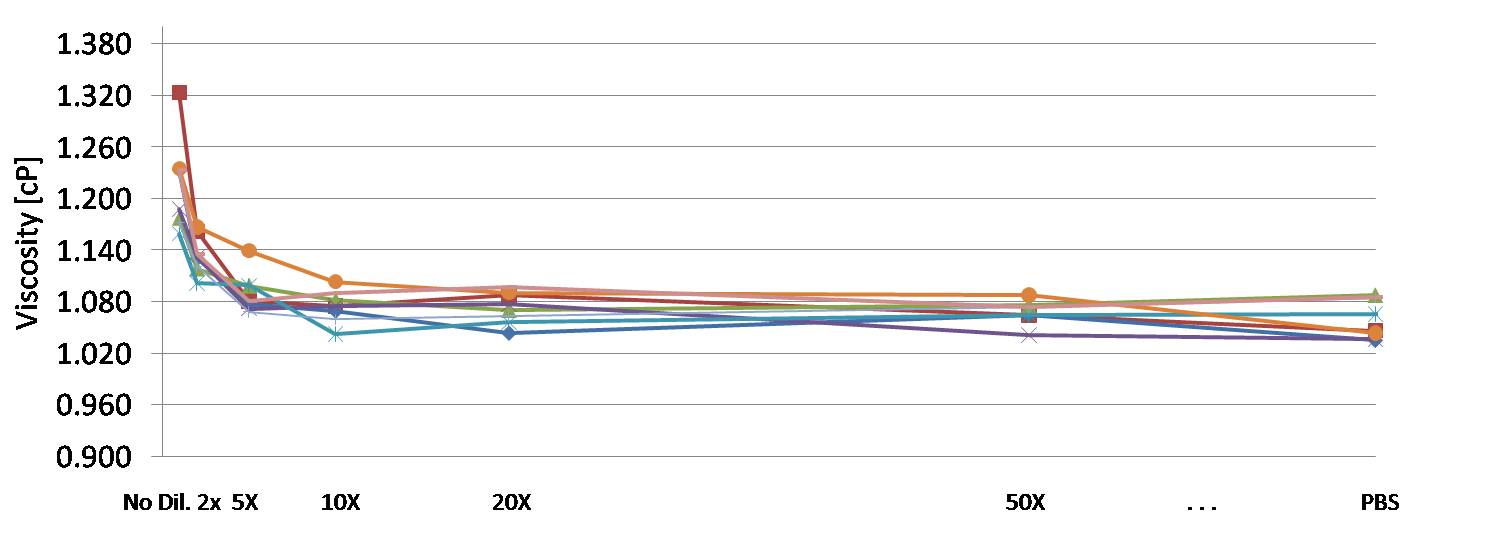
"In brief, we used the RheoSense to measure the viscosity of cellular suspensions. Our goal was to determine the dilution factor needed for the cell suspension to match a running buffer. As demonstrated in the graph this happens around a 10 fold sample dilution factor. Consistent sample viscosity will enable CytoVale to develop robust cellular assays for our core applications involving the high throughput mechanical measurement of cells.
The RheoSense viscometer enabled us to quickly and accurately measure small aliqouts of sample which was necessary due to limited amounts of biological material. Additionally the low volume allowed us to gather many replicates of data in order to accurately assess biological variability between and across samples. This capability allowed us to have much more robust data collection and higher sample sizes for each point on the curve as compared to using traditional capillary viscometry."