.png?width=200&height=58&name=RheoSense%20Logo%20(REGISTERED).png)
Thank You - More than meets the eye: Rheology Application
Application Note
More than meets the eye – Impact of viscosity on eye drop retention
Key Words: viscosity, shear thinning, ophthalmic formulation, dry eye drops, non-Newtonian,
Carreau-Yasuda model, Cross model
Goal: This application note is the first in a series that explains the importance of viscosity and its shear rate dependence on the performance of eye drops formulated for the relief of dry eye. Since an adequate amount of product must remain in the eye to provide any benefit, the first performance factor is the fluid volume or film thickness retained at the time of application. A theory developed for fluid drainage from a curved surface is presented to establish the importance of the low shear viscosity on this property. Viscosity versus shear rate data is presented for seven over the counter products. The non-Newtonian data is fit with either the Carreau-Yasuda or Cross models to estimate the zero-shear viscosity limit used to compare product loss versus time for the various samples.
Introduction
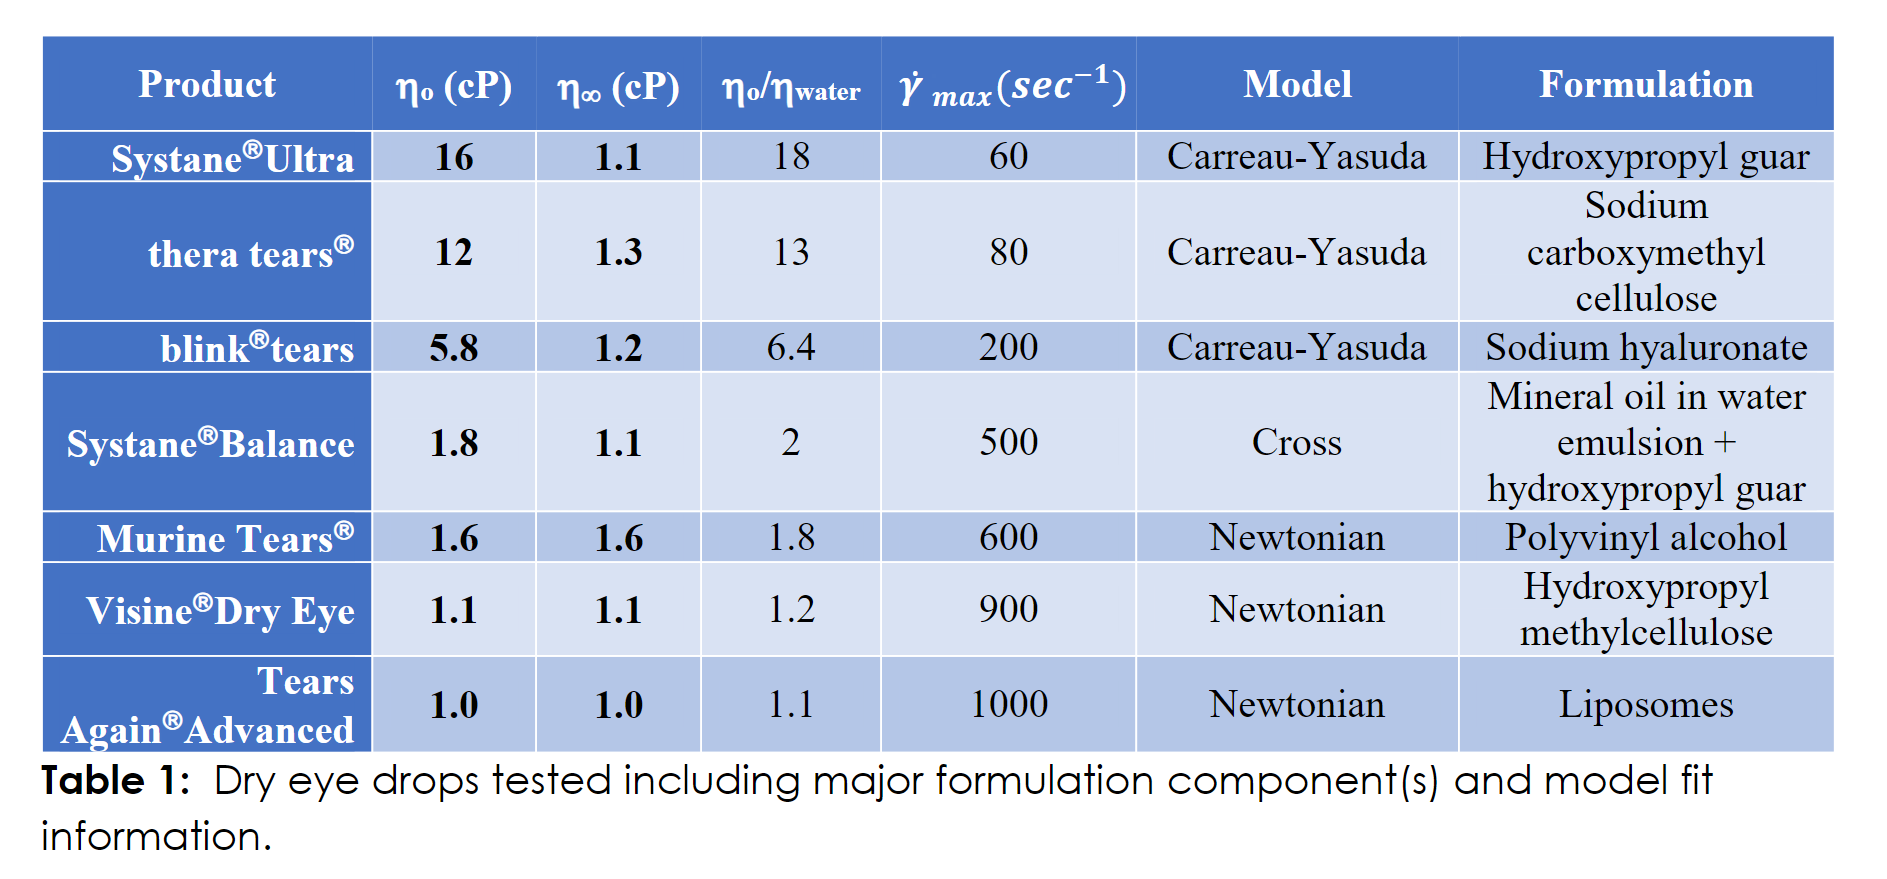
A variety of eye drops formulated to treat dry eye symptoms are currently on the market. The products measured in our study are listed in Table 1 with the primary component(s) included. One formulation approach is to develop shear thinning solutions consisting of either water- soluble polymers or oil in water emulsions. The supporting belief is that this will provide optimal performance from the initial point of insertion and throughout the blink cycle which involves a broad range of shear rates. We start our analysis at the time of insertion and consider how viscosity will impact the volume of product retained, which is the first step in relieving dry eye symptoms. A theory originally developed to model the thinning of the tear film is applied here to estimate the drainage rate of the eye drops over the curved surface of the cornea.
Experiment
Viscosity versus shear rate curves for the seven commercially available eye drops listed in Table 1 were measured at 25°C using the m-VROC®. The accessible shear rate range was specific to each sample with all data falling between 200 and 100,000 sec-1. Multiple chips were used to achieve this broad range (A04, B05, C05). The true shear rate was calculated using the Weissenberg-Rabinowitsch correction for the non-Newtonian fluids.
Viscosity Data and Analysis
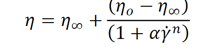
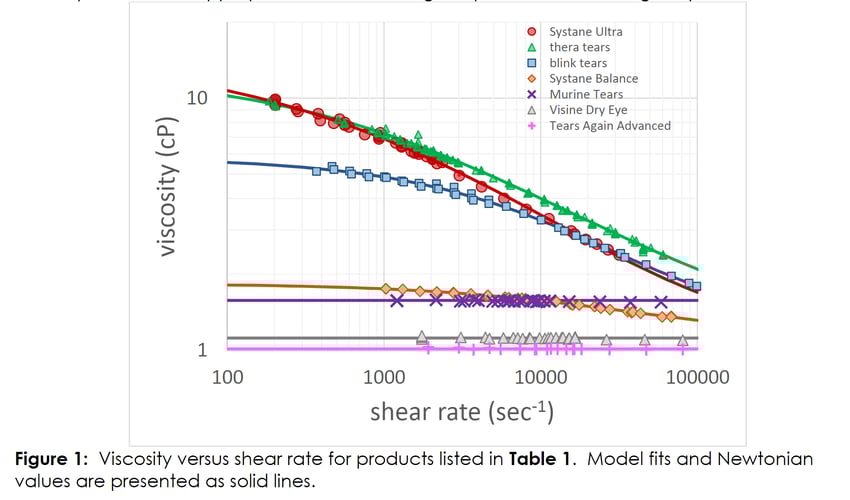
The viscosity ![]() versus shear rate (𝛾̇) data for all dry eye formulations is presented in Figure 1. The data for the non-Newtonian samples was fit with either the Carreau-Yasuda model.
versus shear rate (𝛾̇) data for all dry eye formulations is presented in Figure 1. The data for the non-Newtonian samples was fit with either the Carreau-Yasuda model.
or the Cross model.
Zero ![]() and infinite
and infinite ![]() shear viscosity values determined from the model fits are also
shear viscosity values determined from the model fits are also
included in Table 1.
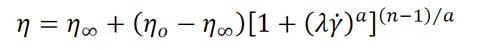
To predict the viscosity dependent drainage of a fluid from a hemispherical surface, we use the theory developed by Bhamla et al. (2014) for the case of a zero-stress boundary condition at the air-fluid interface. The time dependent film thickness (h) at the apex of the eye scaled on the initial value (ho) is then given by the following equation.

Dimensionless time ![]() is defined as
is defined as 
with ρ the fluid density, g the gravitational constant, R the radius of curvature, η the viscosity, and t dimensional time. For the zero-stress boundary condition, the constant ∝ is equal to 1/3. The maximum shear rate during the drainage will scale as ρgh/η. This estimated value for each formulation is listed in Table 1. For the non-Newtonian samples, it is the low or zero shear limiting viscosity that is most appropriate for use in the gravity driven film drainage equation.
Discussion
The viscosity versus shear rate profiles vary considerably among the products with a mix of Newtonian and shear thinning behavior. The lowest viscosity sample is nearly equivalent to water with the other extreme being nearly 20 times more viscous. Since most of the formulations are polymer solutions, the Carreau-Yasuda model provides the best fit to the data. One exception is the oil in water emulsion which behaves more like a particulate or colloidal dispersion and is best fit with the Cross model. The model fitting provides an estimate for the low and high shear limiting values when measurement in these regimes is not possible. It is the low or zero shear limit that is utilized in the product retention analysis that follows. Most are familiar with the experience of tilting back their head to insert eye drops. This process can be approximated by the drainage of a fluid over a hemispherical surface as described by Bhamla et al. (2014). Reasonable values for the density (ρ=1g/cm3), radius of curvature (R=8mm), and initial thickness (ho=100µm) are assumed to estimate the film thickness profiles with time. Figure 2 illustrates the relative film thickness versus time for each product tested. The rate of drainage or thinning is slowest for the higher viscosity samples. After only 0.5 seconds, the range in fluid loss is 20 to nearly 70 % for the highest and lowest viscosities, respectively. The analysis suggests that a higher low shear viscosity will correspond to an increase in product retention.

Concluding Remarks
Viscosity measured in the low shear regime can be related to the rate of film thickness reduction as a fluid drains over a curved substrate. Higher viscosity fluids will drain more slowly resulting in more product retention prior to the blink after eye drop insertion. Knowing the formulation viscosity in this regime is crucial to predicting performance. Stay tuned for our next installment to learn why you should not stop here but continue with a full shear rate characterization.
References
1. M. S. Bhamla, C. E. Giacomin, C. Balemans, and G. G. Fuller, Soft Matter, 2014, 10, 6917-
6925.
If this note is helpful, please let us know! If you have questions or need more information about this product or other applications, please contact us:
Main Office — 1 925 866 3801 Sales – Sales@RheoSense.com
Information — info@RheoSense.com